


Monthly Subscription
The Climate Membership
Invest in nature to restore ecological balance, and offset your daily impact with The Climate Membership. Here's how it works:
Choose your plan
Choose your monthly climate membership plan, starting at $1 per month
Choose your impact
Choose your impact focus: Protecting Nature, Safeguarding our Oceans, Preserving Biodiversity, or driving the transition to Renewable Energy
Track your impact
Checkout and track your impact ROI in your Climate Portfolio

Climate Membership
Verified Impact
All projects are third-party verified by Verra, The Gold Standard or Climate Action Reserve (CAR), oversight that ensures all contributions are directed to the highest quality projects, that:
Due Diligence
Projects are rigorously and independently verified by trusted third-party layers
Additionality
Projects are additional to business-as-usual, meaning the projects would not otherwise be developed without your carbon offset contributions
Permanent
Projects provide emission reductions that are both measurable and permanent according to the highest internationally recognized standards and audits
Impact Projects
Your Climate Membership invests directly in the projects featured below, and will continue to enhance and diversify the project portfolio to ensure we deliver maximum impact with every dollar invested, and with a focused strategy on maximizing your impact ROI.
Rimba Raya REDD+
Location: Indonesian Borneo
Intervention: Peatland Protection REDD+
Verification: Verra, CCB, SDVista
The Rimba Raya Biodiversity Reserve is located in Central Kalimantan, Indonesian Borneo, and is one of the largest REDD+ peatland forest projects in the world, avoiding nearly 130 million tonnes of carbon emissions.
Rimba Raya provides a buffer zone between the palm oil industry and the Tanjung Puting National Park, home to one of the last remaining wild populations of orangutans on earth.
In 2020, the project became the first REDD+ project in the world to be audited for compliance under the SD Vista Standard – achieving the highest possible rating of contributing to all 17 UN SDGs.
Manoa REDD+
Location: Brazil
Intervention: Avoided Deforestation REDD+
Verification: Verra, CCB
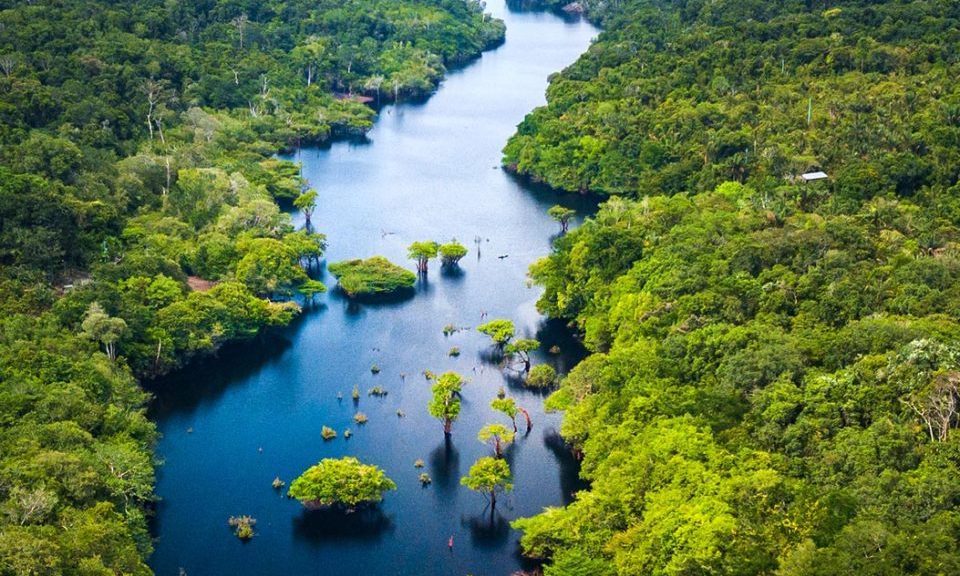
The Manoa REDD+ Project is located in the state of Rondônia, protecting 73,000 hectares of forest, in the region that has experienced one of the highest rates of deforestation in the Amazon, due to large-scale operations that clear forests for beef and soy commodities.
Manoa is recognized by FAO (Food and Ag Organization of the U.N.) as an exemplary case of sustainable forest management.
Mai Ndombe REDD+
Location: Democratic Republic of the Congo (DRC)
Intervention: Avoided Deforestation REDD+
Verification: Verra, CCB
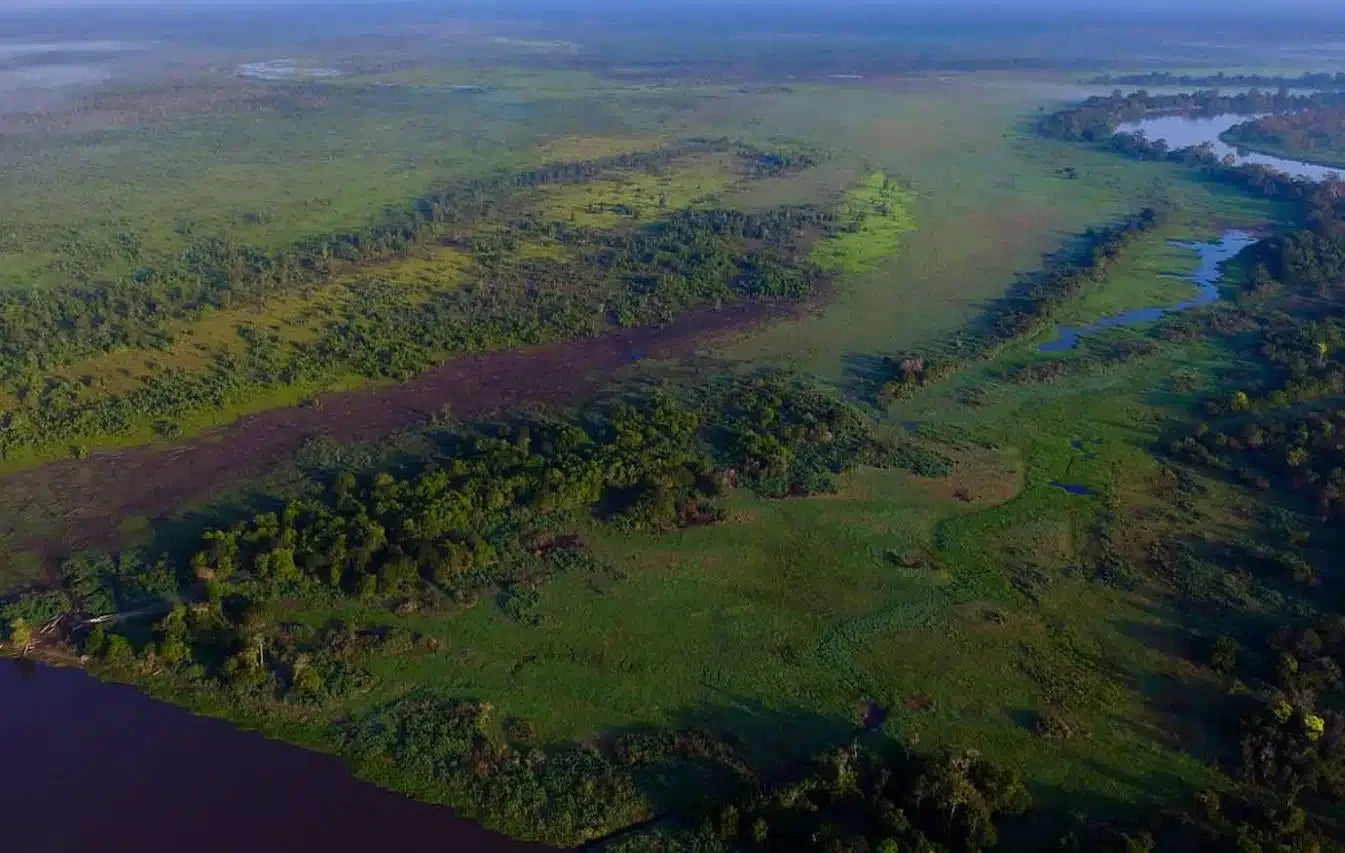
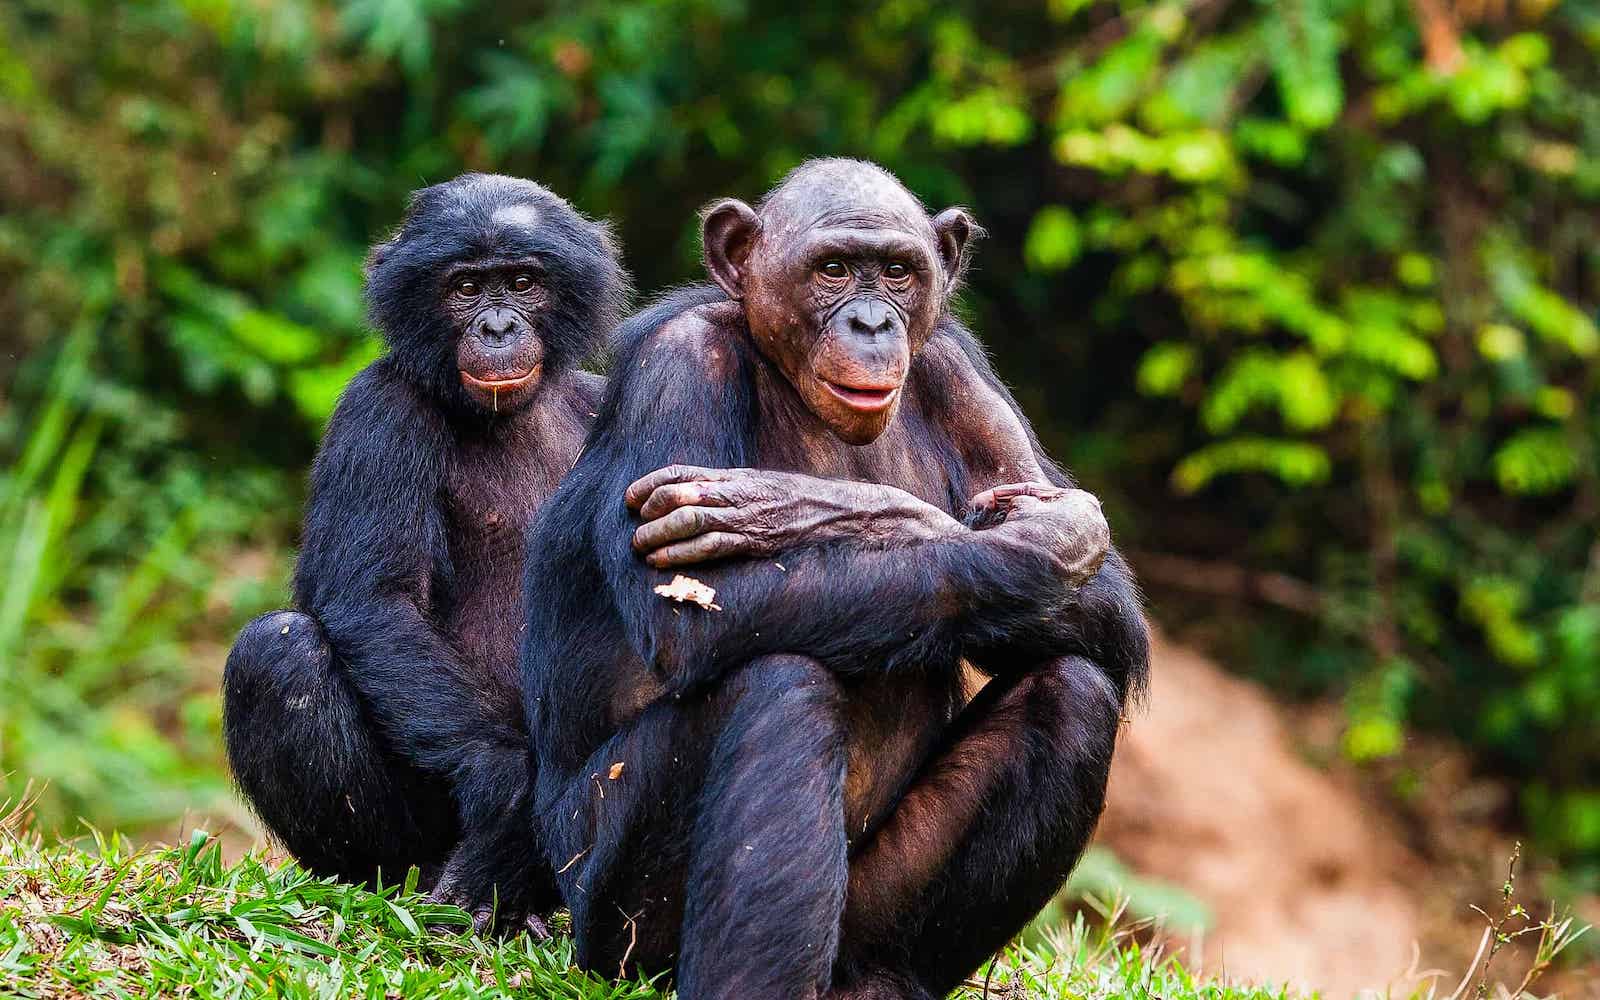
Mai Ndombe protects over 250,000 hectares within the world's second largest intact rainforest, the Congo. The rainforest is home to the bonobo, the endangered great ape that is humankind’s closest relative and found only in the Congo Basin, the endangered forest elephant, and the hippopotamus.
A mix of tropical and swamp forests, the project area is also part of the globally significant Lac Tele-Lac Tumba landscape, one of the most important wetlands in the world and the largest freshwater area on the African continent.
The project also empowers communities in one of the world’s most impoverished countries by creating a pathway to low-carbon economic development, agricultural and economic diversification, education, and healthcare.
Keo Seima Wildlife Sanctuary
Location:Cambodia
Intervention:Avoided Deforestation REDD+
Verification:Verra, CCB
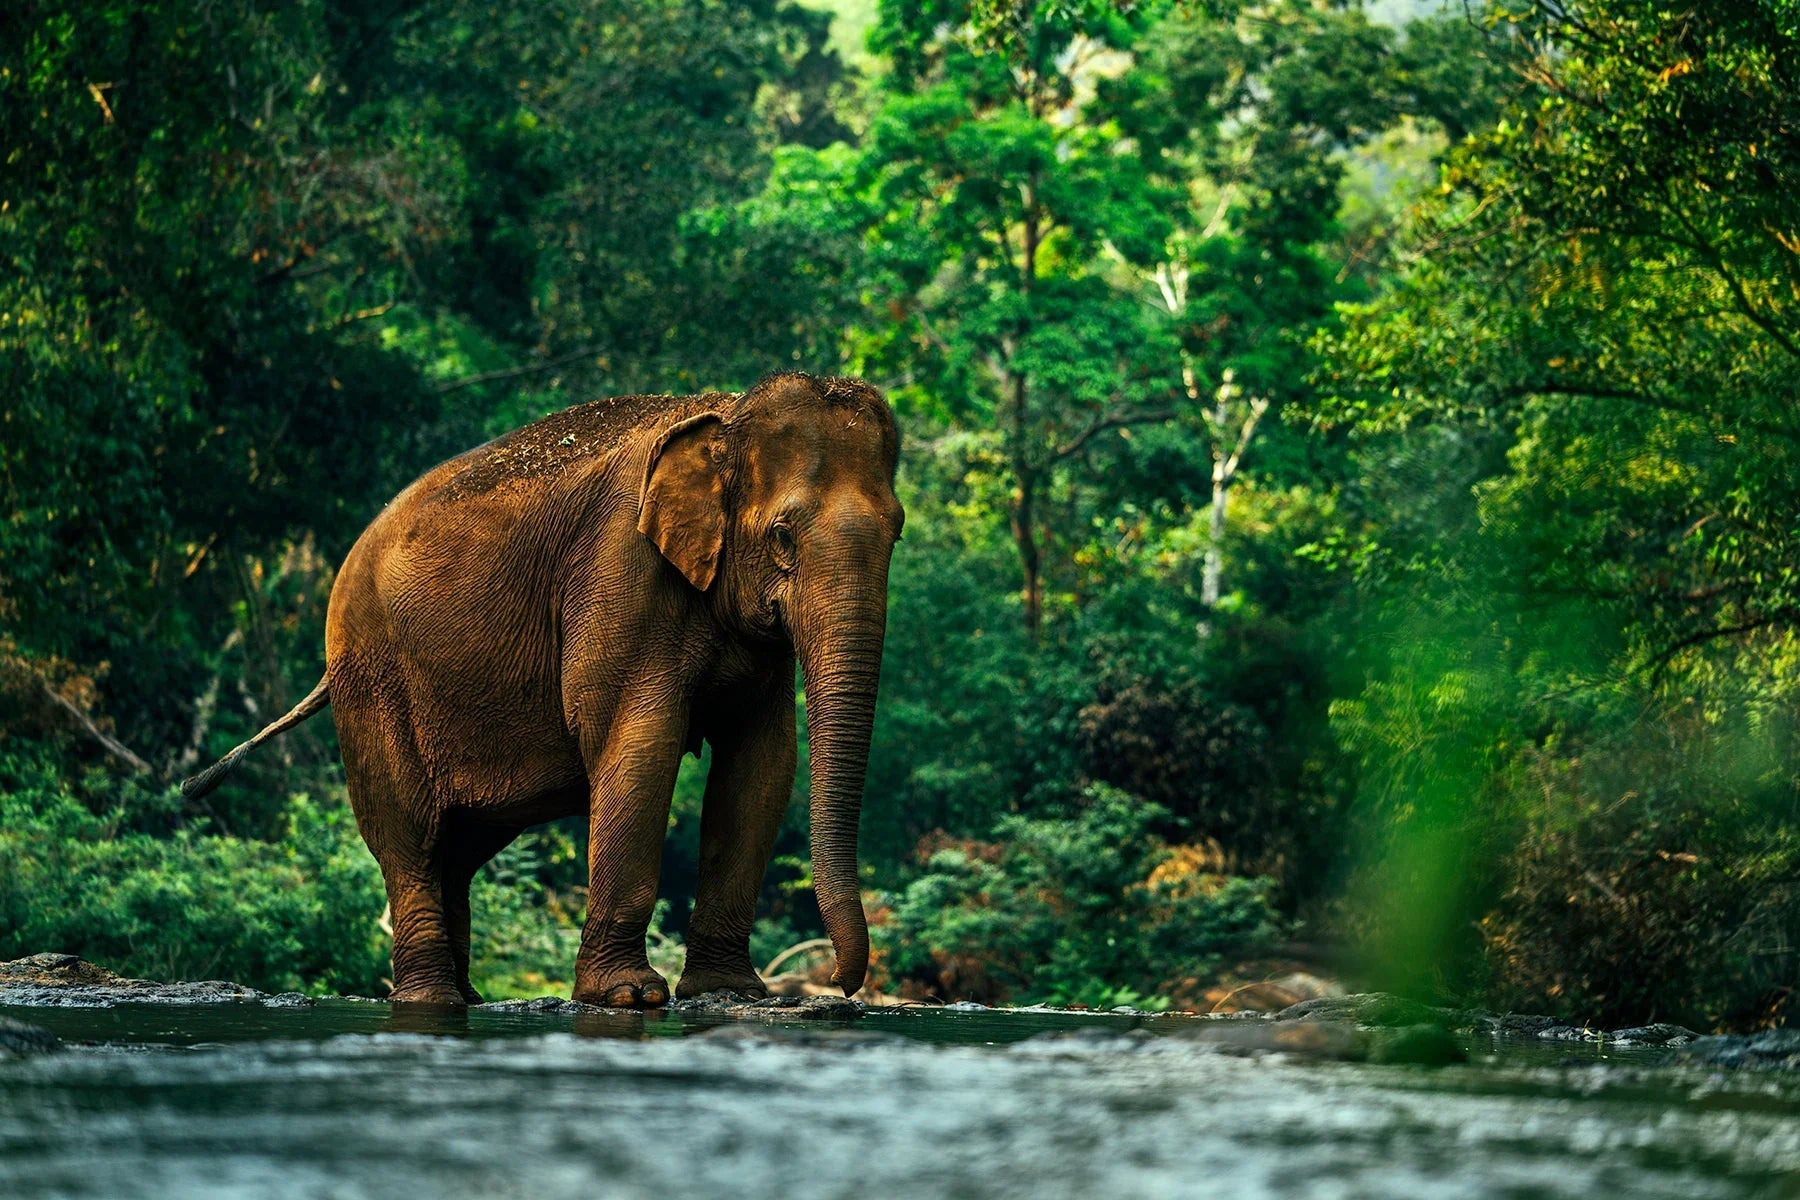
The Keo Seima Wildlife Sanctuary, is a REDD+ project in partnership with the Royal Government of Cambodia's Ministry of Environment. The project protects 160,000 hectares, which is home to over 1,000 species, including more than 85 globally threatened species.
The project area has the highest recorded bird diversity in Cambodia, with over 350 species. It is also home to the world's largest known populations of Black-shanked douc langur and Yellow-cheeked crested gibbons, and it is especially important for monkeys, lesser apes, and lorises, with seven primate species living within its protected boundaries. Fewer than 500 endangered Asian Elephants are found in Cambodia.
Saint Nikola Wind
Location: Bulgaria
Intervention: Renewable Wind Power
Verification: Verra
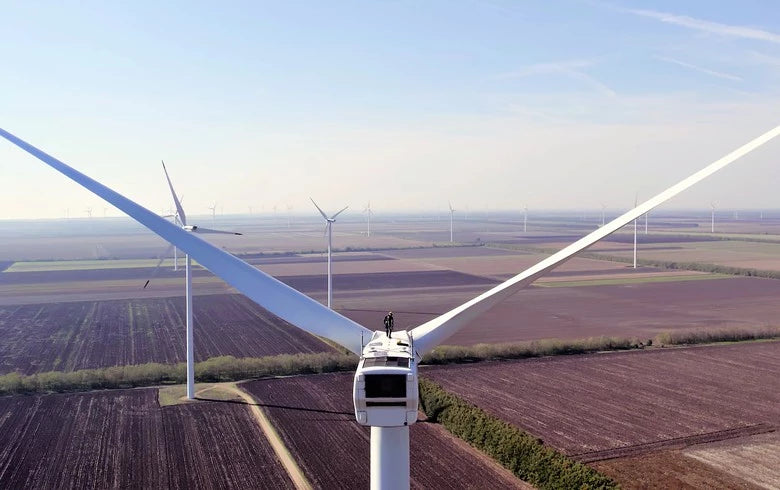
The Saint Nikola Wind Farm is a 156 MW, grid-connected, renewable energy wind farm in Bulgaria. Bulgaria was admitted into the European Union in 2007. The Project consists of a new electrical substation and 52 wind turbines, each with a capacity of 3MW. By producing electricity from a renewable emission-free energy source, the Project contributes to the sustainable, socio-economic development of the region, and improves the use of local energy resources.
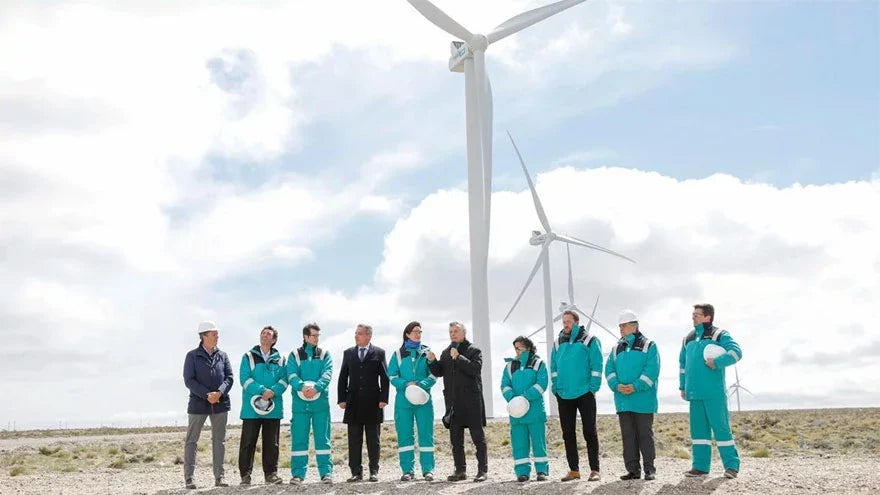
Manantiales Behr Wind
Location: Argentina
Intervention: Renewable Wind Power
Verification: Verra
The Manantiales Behr Wind Power Complex required an initial investment of 200 million dollars, an impressive installation that now reduces fossil fuel generated electricity in Argentina equivalent to 47,500 m3 of diesel or 80 million m3 of natural gas annually. The project provides an annual reduction of 241,600 tons of CO2 from being released into the atmosphere. Manantiales Behr, due to its privileged location, takes advantage of the winds from Patagonia, which have one of the highest factors in the world in terms of installed power capacity.
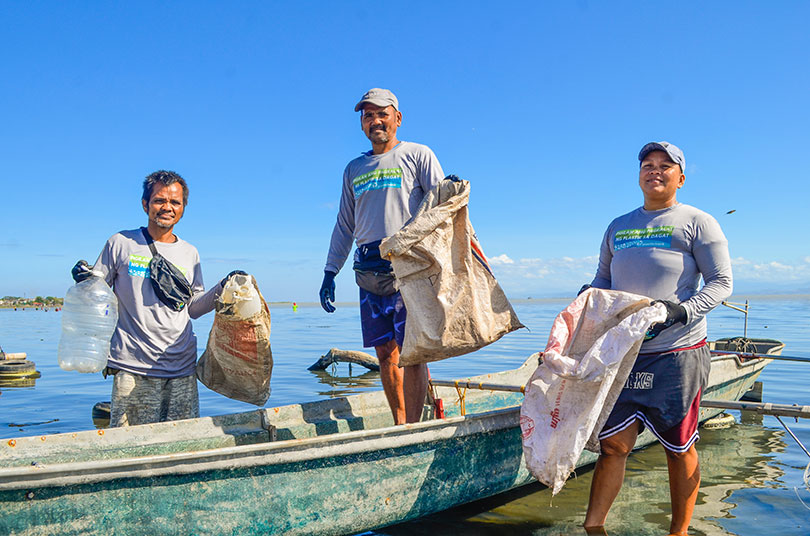
Intercepting Ocean Plastics
Location: Southeast Asia
Intervention: Plastic pollution recovery
Verification: Plastic Bank
Taking proactive steps to curb plastic pollution is essential for achieving sustainability objectives. Carbon Checkout has partnered with Plastic Bank, to play a crucial role in preventing plastic waste from reaching our oceans. Through this collaboration, plastic collection initiatives are facilitated within a 50-kilometer radius of ocean-bound waterways and coastlines.
Designed to harness the transformative power of community action, these efforts are dedicated to capturing ocean-bound plastics from waterways to safeguard the lifeblood of our planet – our oceans. Each dollar invested, captures 50 plastic bottles from ocean-bound waterways.
Blended Impact Portfolio
The "Blended Impact" focus is linked to The Climate Funds, which include The Earth, Ocean, Wildlife and Climate Tech Funds. Your investment is directed to a blended portfolio across these funds and impact focus areas, to deliver meaningful climate action on the ground, where it is most needed.
FAQs
When I choose to "Protect Nature" as my impact focus, what does that mean?
The "Protect Nature" impact focus is linked to The Earth Fund. This visionary fund is dedicated to investing in Nature-based Solutions that protect ecosystems and restore biodiversity, while sequestering global carbon emissions. From forest conservation projects to wetland restoration efforts, your investment in The Earth Fund is a commitment to safeguarding the very essence of life on Earth.
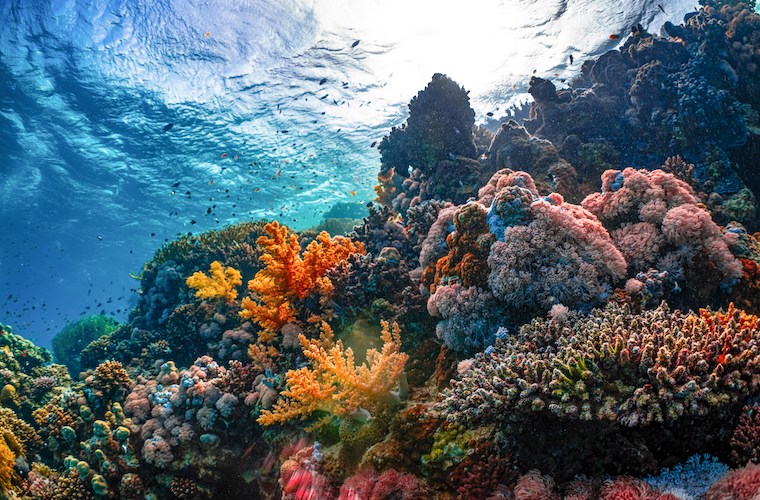
When I choose to "Safeguard our Oceans", what does that mean?
The "Safeguard our Oceans" impact focus is linked to The Ocean Fund. This fund is a pioneering initiative focused on restoring marine ecosystems and combating plastic pollution. By investing in community projects that remove plastics from waterways, you're not just protecting marine life – you're preserving the lifeblood of our planet.
When I choose to "Preserve Biodiversity", what does that mean?
The "Preserve Biodiversity" impact focus is linked to The Wildlife Fund and The Earth Fund. These funds invest in nature conservation, habitat restoration and rewilding efforts to animate the carbon cycle. From lush rainforests to sprawling savannas, your investment is a beacon of hope for biodiversity and a sustainable future.
When I choose to "Transition to Renewable Energy", what does that mean?
The "Transition to Renewable Energy" impact focus is linked to The Climate Tech Fund. This initiative is dedicated to investing in renewable energy infrastructure and emerging technologies. From wind and solar to geothermal and tidal energy, your investment in The Climate Tech Fund is a catalyst for building a cleaner, more sustainable energy grid.
When I choose "Blended Impact", what does that mean?
The "Blended Impact" focus is linked to The Climate Funds, which include The Earth, Ocean, Wildlife and Climate Tech Funds. Your investment is a blended portfolio across these funds and impact focus areas, to deliver meaningful climate action on the ground, where it is most needed.